Last updated on April 27th, 2024 at 09:40 am
Let me begin by telling you how I ended up writing this blog post. It all started when one of my first Power BI report sets was still in development. The question was asked, “Why are the drillthrough filters italicized?” It may not seem like it, but this is an EXTREMELY important point for anyone writing Configuration Manager (ConfigMgr/SCCM/MEMCM) reports with Power BI. Why? The way Power BI natively handles filters, when drilling through from one report page to another report page, can lead to unexpected results. How do you solve this problem? Turn off the Keep all filters option.
By the way, that one question about italicized filters lead to a whole line of questioning which ended up as a series of blog posts about Power BI filters. Now that you know the problem and the solution, let me give you the details.
Turn Off the Keep All Filters Option
Initially, I noticed that the visuals in my Power BI report didn’t display the expected results, but I wasn’t sure why. Then our Chief Architect, Garth Jones, noticed that the filters under the drillthrough area were italicized. In my mind, I disagreed that these filters were the reason. How could they be?
I decided to do some research. I was surprised to learn that the Keep all filters option keeps all data columns from the source page which are then set as filters on the drillthrough page. Aha! This is why the data didn’t make sense.
The Keep all filters option creates a cache of filters every time you drillthrough from the source page to the target page. You can easily identify the drillthrough columns by looking for italicized filters under the drillthrough tab.
In SQL Server Reporting Services (SSRS) almost everything is controlled by the SQL Server query. This is also true in Power BI, BUT if you add filters incorrectly to your report page, you get unexpected results!
Garth says all the time, even in his MMS presentations, “Always ask yourself, does the data make sense?” This is for all of you report developers out there: the most time spent is not creating the report itself or finding the correct SQL Server queries, but rather, the most time you will spend is ensuring that the report does exactly what you expect it to do.
Computer Application Details Report
I am using Enhansoft Reporting’s Computer Application Details report to show you this problem. The report page displays a table with all ConfigMgr/SCCM/MEMCM applications (and packages) deployed and installed on a particular computer. With the Keep all filters option turned On the results are not complete. I will show you in a bit what I mean by that.
In order for you to understand the problem better, I will describe this report set in its entirety. It starts with an overall report called the, Count of Deployed Applications. Then you drillthrough to the List of Computers by Application page. From the list report, you drillthrough to the Computer Application Details page. The drillthrough from the list page to the details page (the last step) highlights the problem nicely.
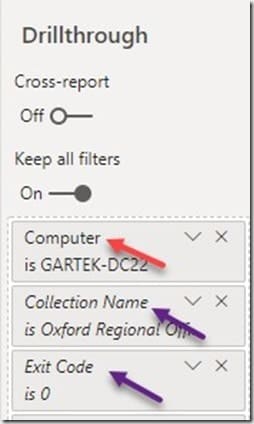
This is how the filters look in Power BI in the last step.

From the above image you can see that the italicized filters (purple arrows) are the transitory drillthrough filters from the source page. These filters further refine data from the visuals. The red arrow shows the actual column (Computer) setup for drillthrough during report creation. The purple arrows are pointing to the temporary columns (Collection Name and Exit Code) that were added when the drillthrough was performed from the source page.
Keep All Filters

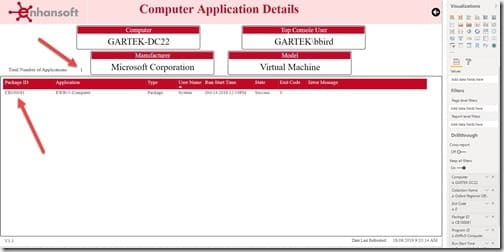
The above image shows what the page looks like when the Keep all filters option is on. Notice that only one application is associated with this computer? This is where Garth’s question comes into play, “Does the data make sense?” Is it realistic that only one application is deployed to this computer within SCCM? It is possible, but unlikely. Look a little closer at the screenshot. Do you see some of the other italicized filter items in the lower right corner? They could also be filtering the results without anyone realizing it.

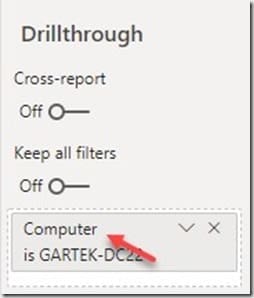
Next, I turned off the Keep all filters option. See the screenshot below.

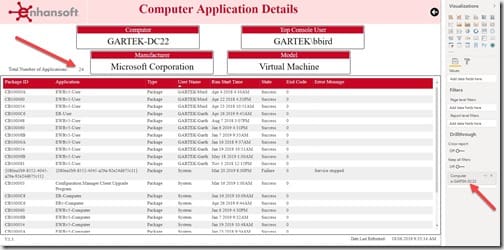
Here is the same report page when the Keep all filters option is turned off. Notice that there are no italicized filters? Now check out all of the applications associated with the same computer. Again, thinking of what Garth says, doesn’t this make more sense? I think so! 24 applications deployed to this computer makes far more sense than only one application.
Conclusion
In Power BI, the Keep all filters option is often overlooked. You need to watch out for it because your reports could be displaying incomplete (inaccurate) information. This could lead to you or your management questiong SCCM’s value.
I encountered this problem when generating my Power BI reports. The reported data did not make sense, particluarly when I had the benefit of reviewing the SSRS equivalent of the same report. This is ultimately how I found out that the Keep all filters option was doing it’s job. But it stopped me from getting the results I needed. Making one simple change was all it took.
Always think of the data. If your gut is telling you that it is wrong, then prove it one way or another! Either you find the answer or you validate the results. IMO, this is time well spent.
Have you come across something similar with drillthrough filters or slicers? Let me know how you dealt with it. If you have any questions about the Keep all filters option or Power BI reports you can always ping me @SuaresLeonard. Finally, don’t forget that you can subscribe to my RRS feed to stay on top of the latest trips and tricks.
