Last updated on April 27th, 2024 at 10:14 am
Hi Everyone! In this blog post I show you how to add a card in order to display the total number of computers in a Power BI table. It doesn’t matter if you are designing a SQL Server Reporting Services (SSRS) report or a Power BI report, end-users don’t have the time to count the number of items listed in a report. They want to know as quickly as possible the total number of whatever they are interested in. I want to focus on the total number of computers in a Power BI table because it is helpful to show the number of devices affected by your selection and filters.
Add a Card with the Total Number of Computers in a Power BI Table
In this example, I am using Enhansoft Reporting’s SQL Server Power BI dashboard and I am going to show you how I created a card to display the total number of computers.
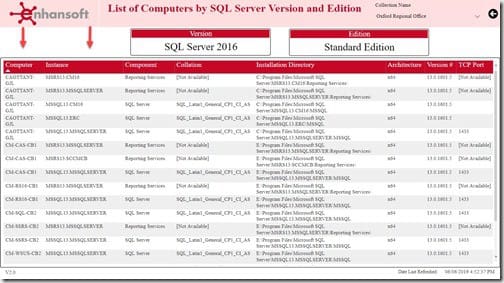
Above is a screenshot of a report page from the SQL Server Power BI dashboard. This particular page displays a List of Computers by SQL Server Version and Edition. On this page, I want to create two Power BI cards. Not only do I want to show the total number of distinct computers, but I also want to display the total number of SQL Server instances associated with these computers.

The following three steps are what you need to do in order to display the total number of computers in a Power BI table.
Step 1
First, you need to setup a text box in order to display the text. Start by selecting the Text box from the Home ribbon as shown in the above image.
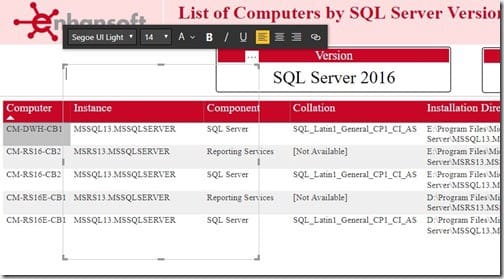
Once on the canvas, resize the text box in order for it to fit in the desired location. Next, add the text you want in it. In my case it’s, “Total Number of Computers:” Format and align the text accordingly.

Above is how my text box looks after I formatted and aligned the text. This is the end of step one.
Step 2
The second step involves positioning the card.
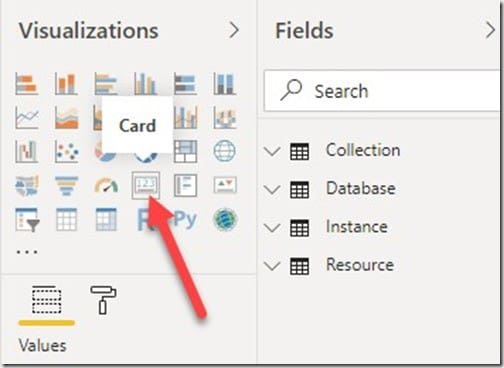
Start by selecting the Card option from the Visualizations pane.
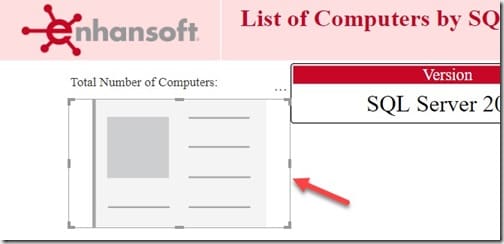
Once on the canvas, similar to what you did with the text box, resize it and position it to the desired location.
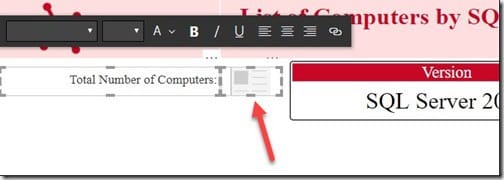
Now you are going to place the text box and the card next to each other ensuring that they appear as one seamless entity (see above).
Step 3
At this point, you must choose the column data you want displayed on the card.
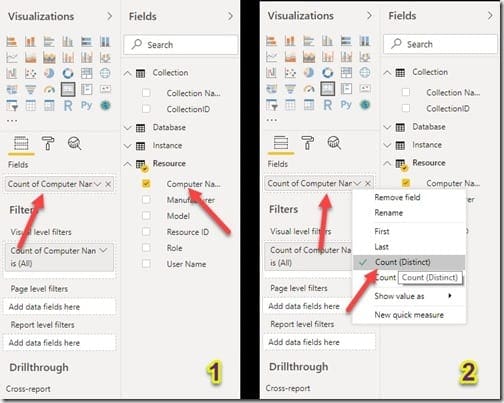
First, highlight the card on the canvas. Next, select the column from the dataset and drag it to the Fields pane (1). You can see in the above image that I’m counting the total number of computers. Once the selected column is in the Fields pane, click on the down arrow and select the Count (Distinct) option (2).
Keep in mind that you can choose whatever you want to display on the card. Customize it in order to fit your own reporting needs.
End Result
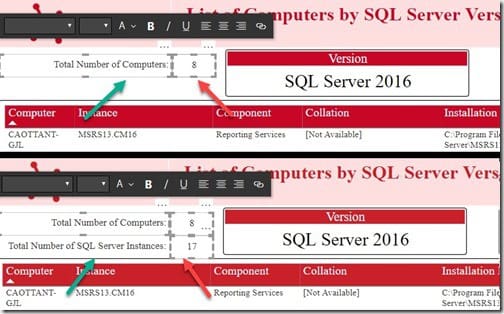
You can see in the above image the completed setup for the two cards (red arrows) and the two text boxes (green arrows) that I created. There’s one for distinct computers and there’s one for SQL Server instances. I positioned the cards in the top left-hand corner, just above the table, and matched all of the fonts and text box sizes in order for them to be consistent.
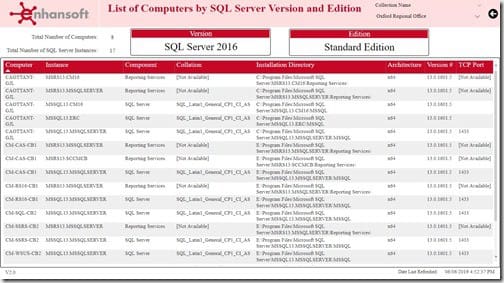
Above is the finished report. When looking at it for the first time, you see immediately how many computers and SQL Server instances are associated with a specific collection of computers.
Conclusion
How many times have you looked at a report and wondered how many of “x” are there? Follow this easy three-step process whenever you want to add the total number of computers to a Power BI table. This tip, in particular, really helps to give a report a polished look and feel.
Microsoft Power BI provides a number of user-friendly ways to build add-ons for your reports. I hope you can also find many uses for them in order to build great reports. If you have any questions regarding this blog post or Microsoft Power BI, you can reach out to me on Twitter @SuaresLeonard. Until the next time, good luck!
