Last updated on August 1st, 2022 at 02:34 pm
Continuing on with my Power BI Desktop blog post set. (How to Install Power BI Desktop, Getting Started with Power BI Desktop and SCCM, Adding a Calculated Column to a Power BI Table and Adding a Chart to a Power BI Dashboard). Where I showed you how to create a basic Power BI dashboard, in this blog post I will show you how color is used in Power BI and SSRS dashboards. In my opinion, color is one of the areas where Power BI falls short when compared with SQL Server Reporting Services (SSRS). In SSRS you can assign colors to charts or tables by using its color code feature. However, a similar feature doesn’t exist within Power BI.
I will demonstrate what I’m talking about by taking the Power BI chart (where I left off in the previous post) and comparing it with a similar SSRS-designed chart. My focus will be on changing the chart’s wedge colors.
Why Is Color Important?
How color is used in Power BI and SSRS dashboards is important. Because if a chart is well-designed you can know in an instant what it is telling you! Choosing the right colors in a dashboard is particularly useful when a Manager needs to review it. At a quick glance they can see their environment’s status and they don’t have to inspect each item in order to understand its meaning.
If you saw a chart about computer ages, what color do you think should represent Virtual Machines (VMs)? What color do you think should represent a 1-year-old computer compared to a 9- year-old computer?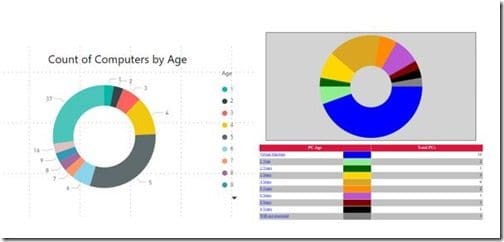
Let’s take a look at these two charts. They are using the same dataset, but different colors appear for different values.
In the Power BI chart on the left, the red-colored wedge represents computers that are 3-years-old. In the SSRS chart on the right, 3-year-old computers are represented by the color gold. You don’t see it here, but red in the SSRS chart represents, “Error.” Doesn’t that make more sense?
Let’s take another example, in the Power BI chart, computers that are 9-years-old are represented by a blue wedge. Whereas in the SSRS chart the wedge representing these computers is the color black. It makes more sense, I think, to show computers that are 9-years-old as, “black,” than it is as, “blue.”
How Color Is Used in Power BI
It is important to note that by default all colors are randomly selected in Power BI based on the chosen color palette. This means that the assigned colors have no meaning, but will be visually appealing.
How Can I Change the Default Colors in Power BI?
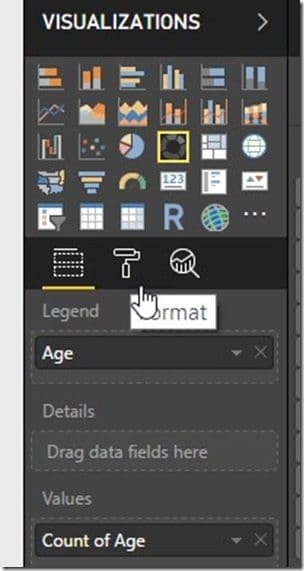
Start by selecting your chart on the canvas. Then in the VISUALIZATIONS area, select the paint roller.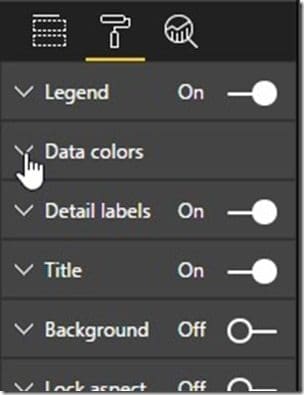
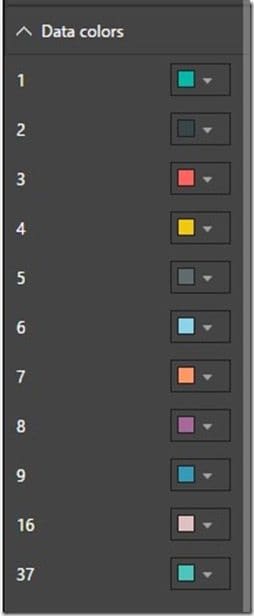
The first thing that I want you to notice is that the values, “0,” and, “10,” are missing from this list. In my query it is possible to have results for these values. However, since no computer in my test lab is either under 1-years-old or 10-years-old then these values do not appear. This means that I cannot assign a color for, “0,” or, “10.” Eventually Power BI will randomly select colors for these values when computers with this age appear in the results.
Using the following color codes I’m going to update my Power BI donut chart.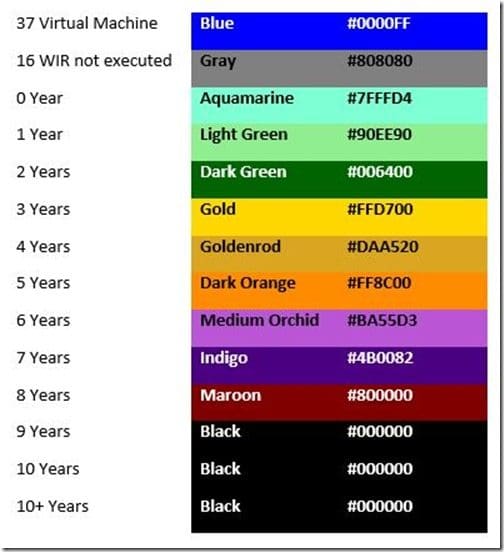
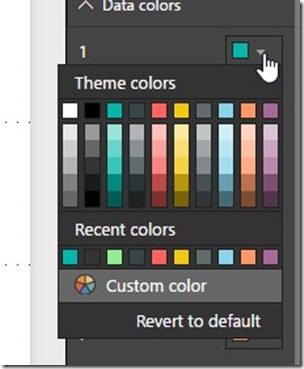
Taking the value 1, expand the color button and then click on Custom color.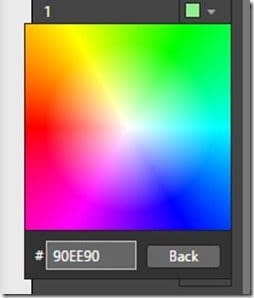
Enter the Hex color code and hit enter.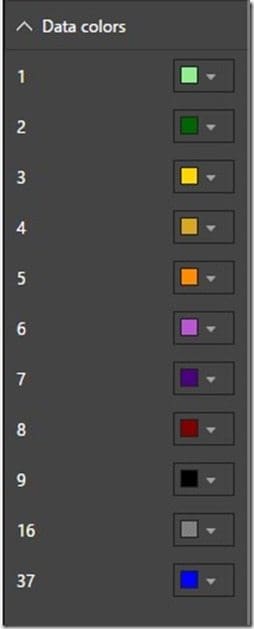
Repeat this process for all available values.
Reviewing the Results
Again, notice that I can’t assign a color code for either, “0,” or, “10.” Again, this means that Power BI will randomly select a color and there goes my perfectly chosen color palette. My only work-around would be to create a, “fake,” dataset that includes all of the possible options. Then I could assign each value a color.
What happens, though, when a computer is older than 10-years-old? You’ll notice in my SSRS color codes that I have an option for 10+ years. But that isn’t possible with Power BI. So computers that are 11, 12, etc. years-old will be given a randomly assigned color.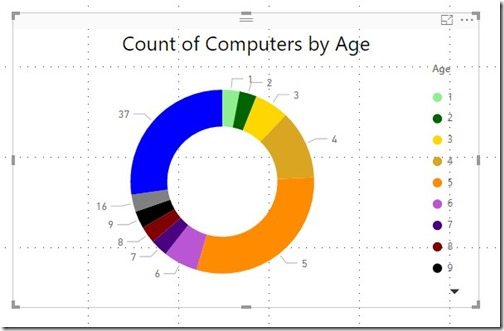
This is my final design. I think that these colors help to convey that a quarter of the physical computers are aged four and under. Starting in the 12 o’clock position you can easily infer that computer ages appear from newest to oldest. By the way, there is very little control over where the results are positioned in the donut.
How Can I Change the Colors in SSRS?
I could write an entire blog post about how to change colors using SSRS’ color code feature. But in this post I’ll stick to the basics and show you how I changed the color for each value and set the default value to black.
Before I show you the color codes that I used, here are a couple of important items to note:
First, you can assign a default color value. In my example it will be #000000 – Black.
Second, you can mix and match color names and Hex color codes within a color code block.
Below is the color code block that I used in my SSRS chart. A screenshot of the final design appeared at the beginning of this post.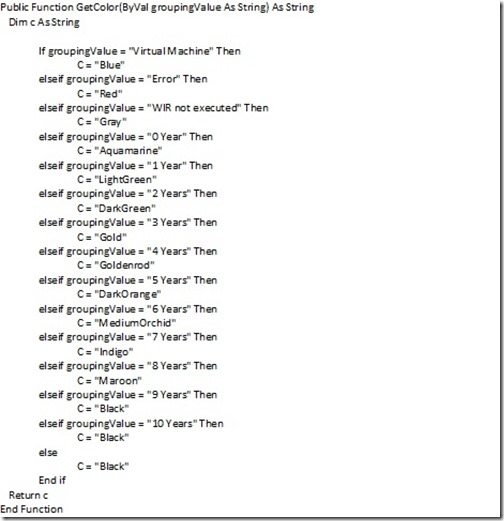
Summary
I hope that in this post I shed some light on how color is used in Power BI and SSRS dashboards. You saw how I changed the colors of the Power BI donut chart’s wedges to make them have more meaning. The colors I chose were better representations of the information I was displaying. This helps anyone viewing the dashboard. You also noticed how I tried to match the colors that I used in my SSRS chart to the ones in the Power BI chart to give you a good comparison of the two. My one wish would be that the Power BI team implement a color code feature similar to the one that I used with SSRS.
These are some additional blog posts that you might be interested in reviewing on the topic of SCCM reports and color:
When is Grey Not a Valid Color?
I Need a Color Palette for My ConfigMgr Reports, Now What?
Do you want to learn more about Power BI Desktop? Send me your ideas and questions to @GarthMJ!

